ANAEROBE 2024 – Part 2
This week Branchpoint Biosciences is excited to join the Anaerobe Society of America in Ann Arbor, MI for ANAEROBE 2024 where we’ll be highlighting our ever-growing suite of validated, targeted qPCR assays. While anaerobes are some of the most interesting and important players in human health, working with these fascinating microbes can be notoriously difficult, time consuming and expensive. Not only can it require specialized oxygen free facilities, but anaerobes are notoriously slow growing – taking days to reach the densities necessary for identification. Having a targeted and specific qPCR assay can enable microbial monitoring and quantification directly from a sample within hours, even when your target is in low abundance. We have two blog posts this week covering topics we think are particularly relevant to the ANAEROBE 2024 crowd, but not just ANAEROBE participants! So read on!

Today we are illustrating how relying on sequencing for “quantification” can be deceptive.
Relative to What?
This post is going to be brief! We’ve discussed before how generating microbiome profiles using our qPCR assays mirror that of the current “gold standard” metagenomic analyses and you can read all the details in our preprint on bioRxiv. But something I wanted to revisit was just how dangerous it can be to rely on relative abundance to draw conclusions about your samples. And conversely, emphasize the power of absolute abundance to reveal the true nature of your samples.
First, why is it called “relative abundance”? It is because the value is determined by figuring out how many total reads are generated from your sequencing result (that you trust and hit the fraction of targets you are interested in – all that confounding human DNA!!) and then how many of those reads hit your target(s). The percentage of reads that hit your target is your relative abundance.
It sounds simple enough, but it’s important to remember that the total number of reads generated by the sequencer does NOT reflect the microbial load in the sample. Standard sequencing approaches cannot reveal this information – EVER! You may get more reads from Sample A than B, but that doesn’t mean there are more microbes in Sample A compared to Sample B.
Quantification you can count on

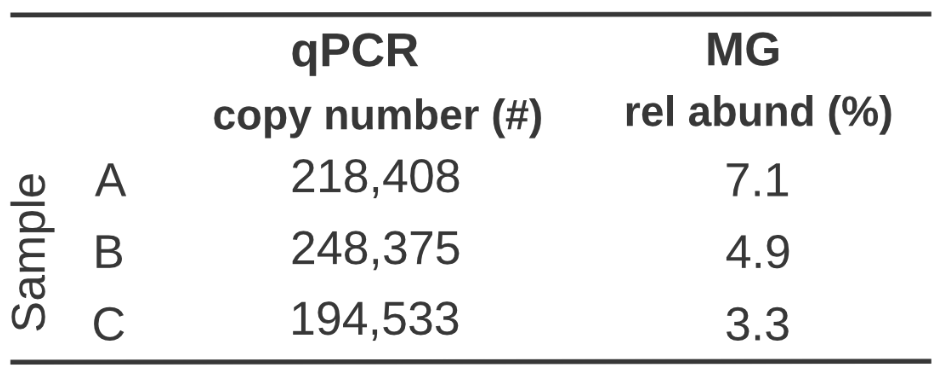
How does this impact your data interpretation though? Well, we can see here when measuring Agathobacter rectalis (another anaerobic microbe), if we simply rank Sample A, B, & C by relative abundance, you might assume Sample A > Sample B > Sample C. But the absolute abundance provided by our qPCR assays, reveals that in fact, Sample B > Sample A > Sample C. And even though relative abundance would suggest that Sample C is less than half of Sample A, in reality their absolute abundance is almost equal. The reason for this is that the microbial load between each sample is different (1.9×10⁶, 2.9×10⁶, and 3.2×10⁶, respectively) so a similar number of targets within Sample A has higher relative abundance.
This can be a wild reminder. I know in my youth I’d make comments like “Yeah. But relative abundance basically can track the amount,” but this is an important reminder that relative abundance is at best an approximation of reality and at worst a confounder. That’s why we are building commercial and research profiling platforms that will help all of us to find the right answer amongst our microbiome samples. Don’t you deserve data you can trust absolutely?
